
Home >
How to: Change chart type of a custom report
You can change the type of chart displayed in a report:
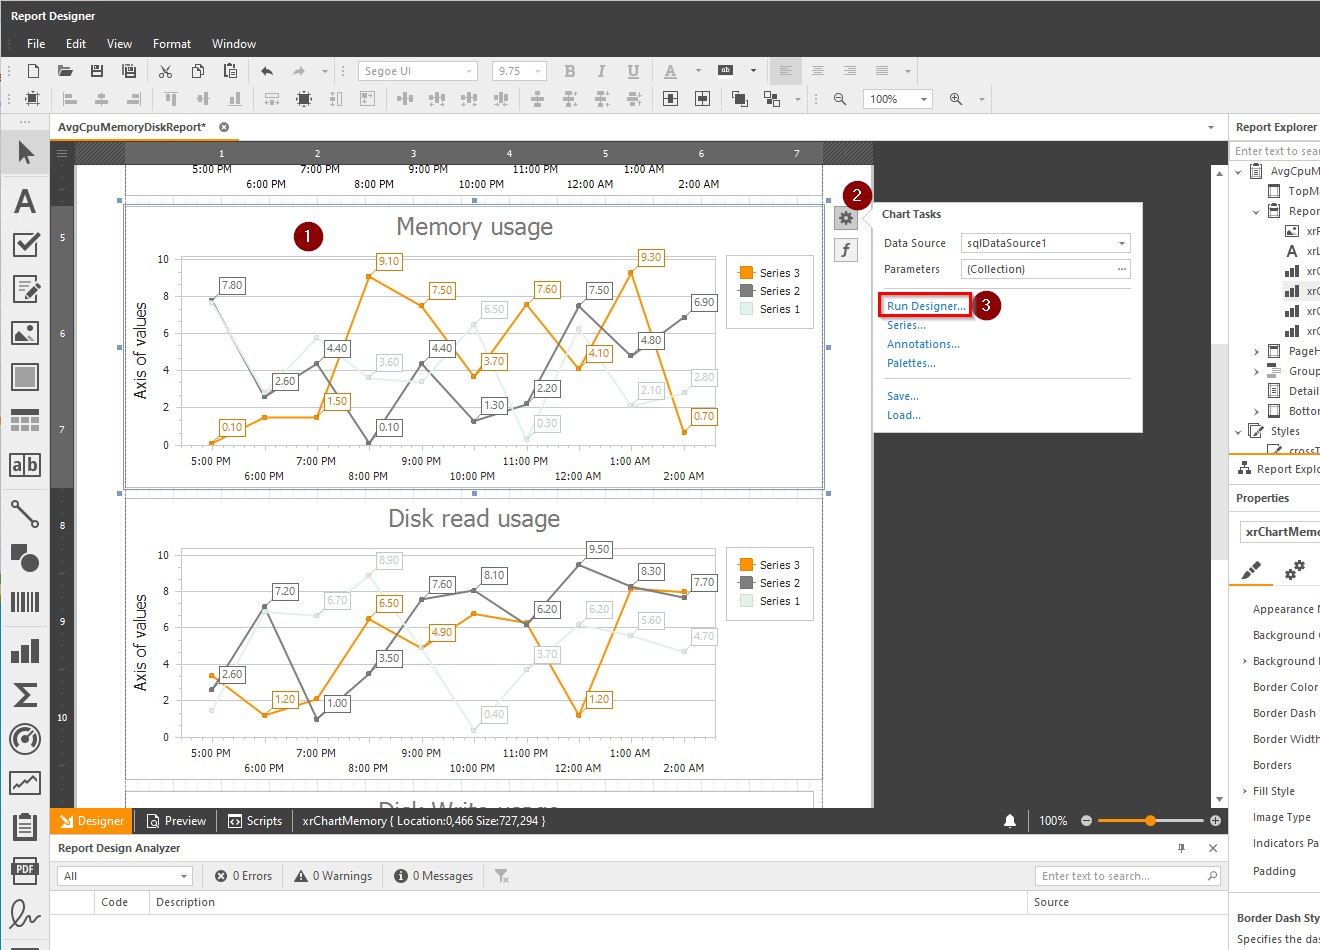
First, select the graph you want to change, then click on the settings button, and click on Run designer:
Then click on the "Change type" button:

Choose the new type:

Click on OK, and look at the modifications applied:
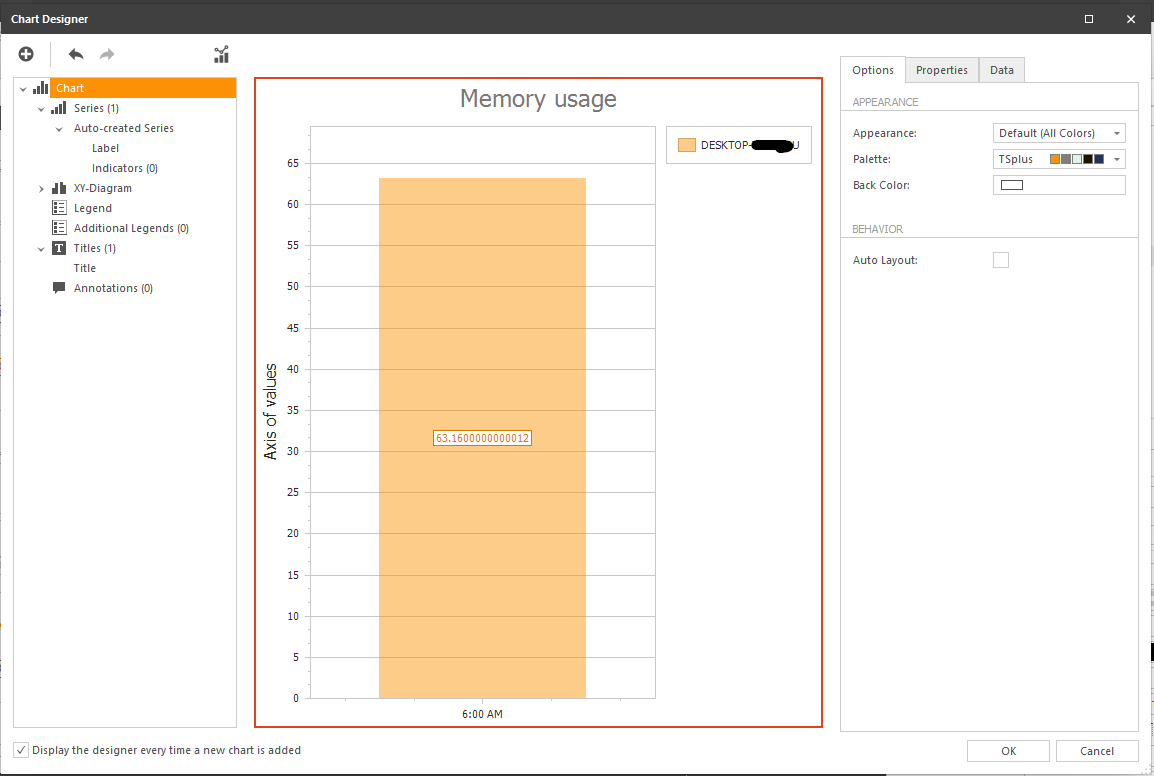
You also can, in this form, customize graph content (title, legend, annotations etc.)